Every figure comes from the records the lists already show.
Reports for sales, expenses, income against expenses, leads and timesheets, with goals, surveys, a dashboard — and an Insights view on every list. A report always agrees with the screen it summarises, because it reads the same records.
Three questions this report answers
- How much came in this month, in each currency we bill in?
- What was invoiced but has not been collected yet?
- Is the team keeping up with the ticket queue?
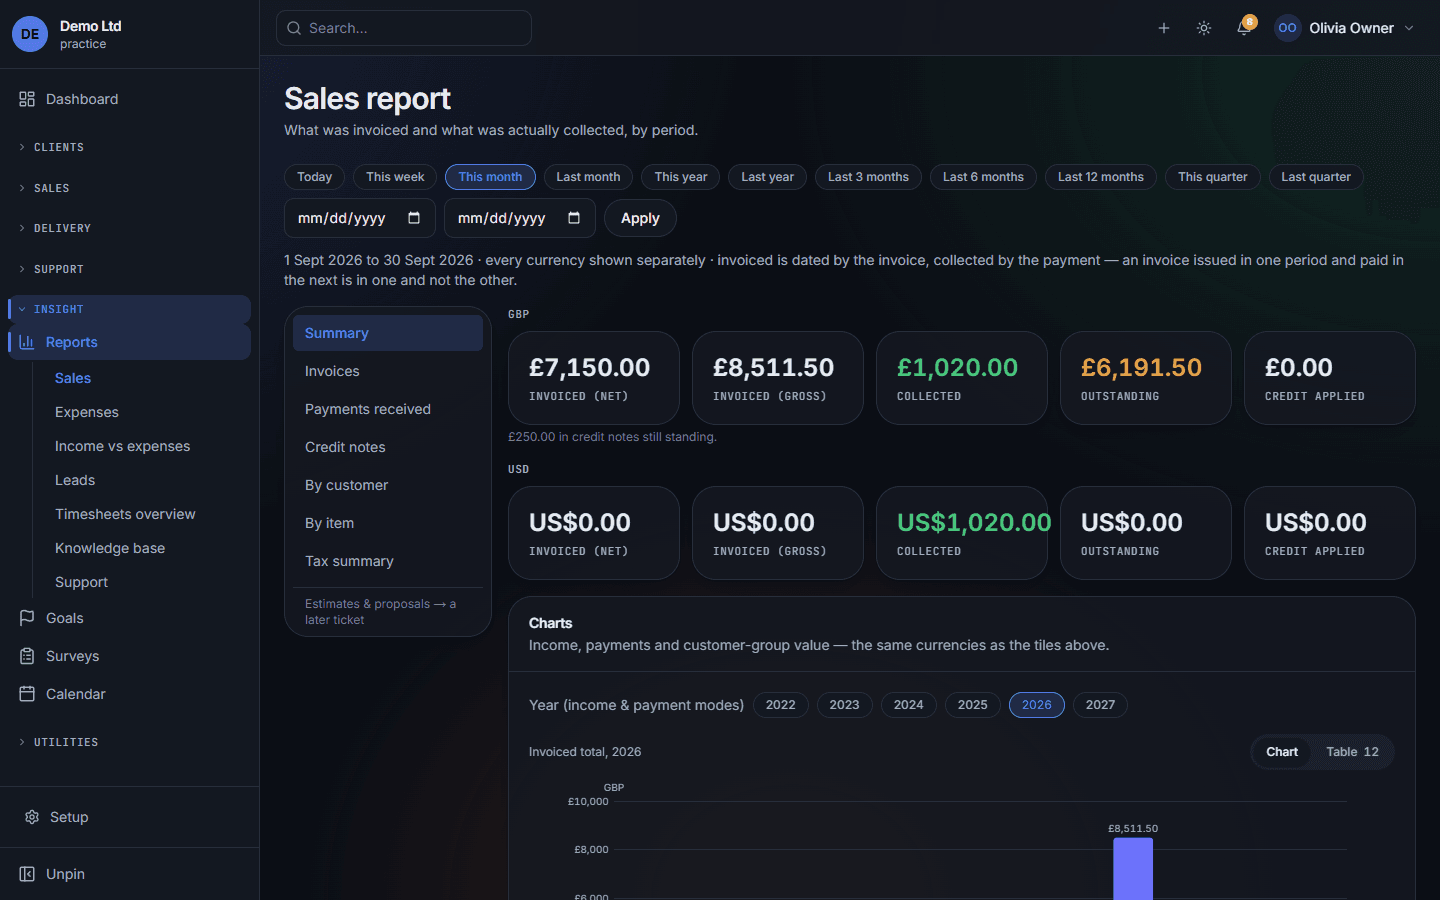
It says what it counts
Invoiced is dated by the invoice, collected by the payment — written on the page, so nobody has to guess why two numbers differ.
Collected is money that arrived
Not money invoiced. They are different questions and the report keeps them apart.
One row per currency
Each currency gets its own figures. Nothing is converted at a rate somebody picked.
Every chart has its table
One click shows the numbers behind the bars — on a phone, for a screen reader, or because a bar is two pixels tall.
Also in Insight
Reports — Sales, expenses, income against expenses, leads and timesheets, each exporting to CSV. Insights on every list — Invoices, tickets, tasks, contracts and the rest each have a second view with the charts that list deserves. Goals — Targets for revenue, conversions or new customers, measured from the records rather than typed in. Surveys — Questions to customers or staff, answered in the portal and read as figures. Dashboard — What needs attention today: overdue money, work in flight, tickets waiting, contracts ending.
Why the numbers can be trusted
Your way of reading, remembered
Somebody who reads tables rather than shapes can have every chart open as its table, on every device they sign in on.
The same access rules as everywhere else
A member who sees only their own customers sees reports of only their own customers.
Counts that add up
Every breakdown’s slices add up to the whole, so no record is ever counted twice or left out.
Fixed, exact, and exportable
The reports are built to be relied on as they are, and every one of them exports to CSV for whatever you want to do next.